Biologic drug manufacturing greatly increases risk across a pharmaceutical site in areas such as quality, manufacturing and environmental health and safety. How might we forecast and mitigate risk with experience design and data science?
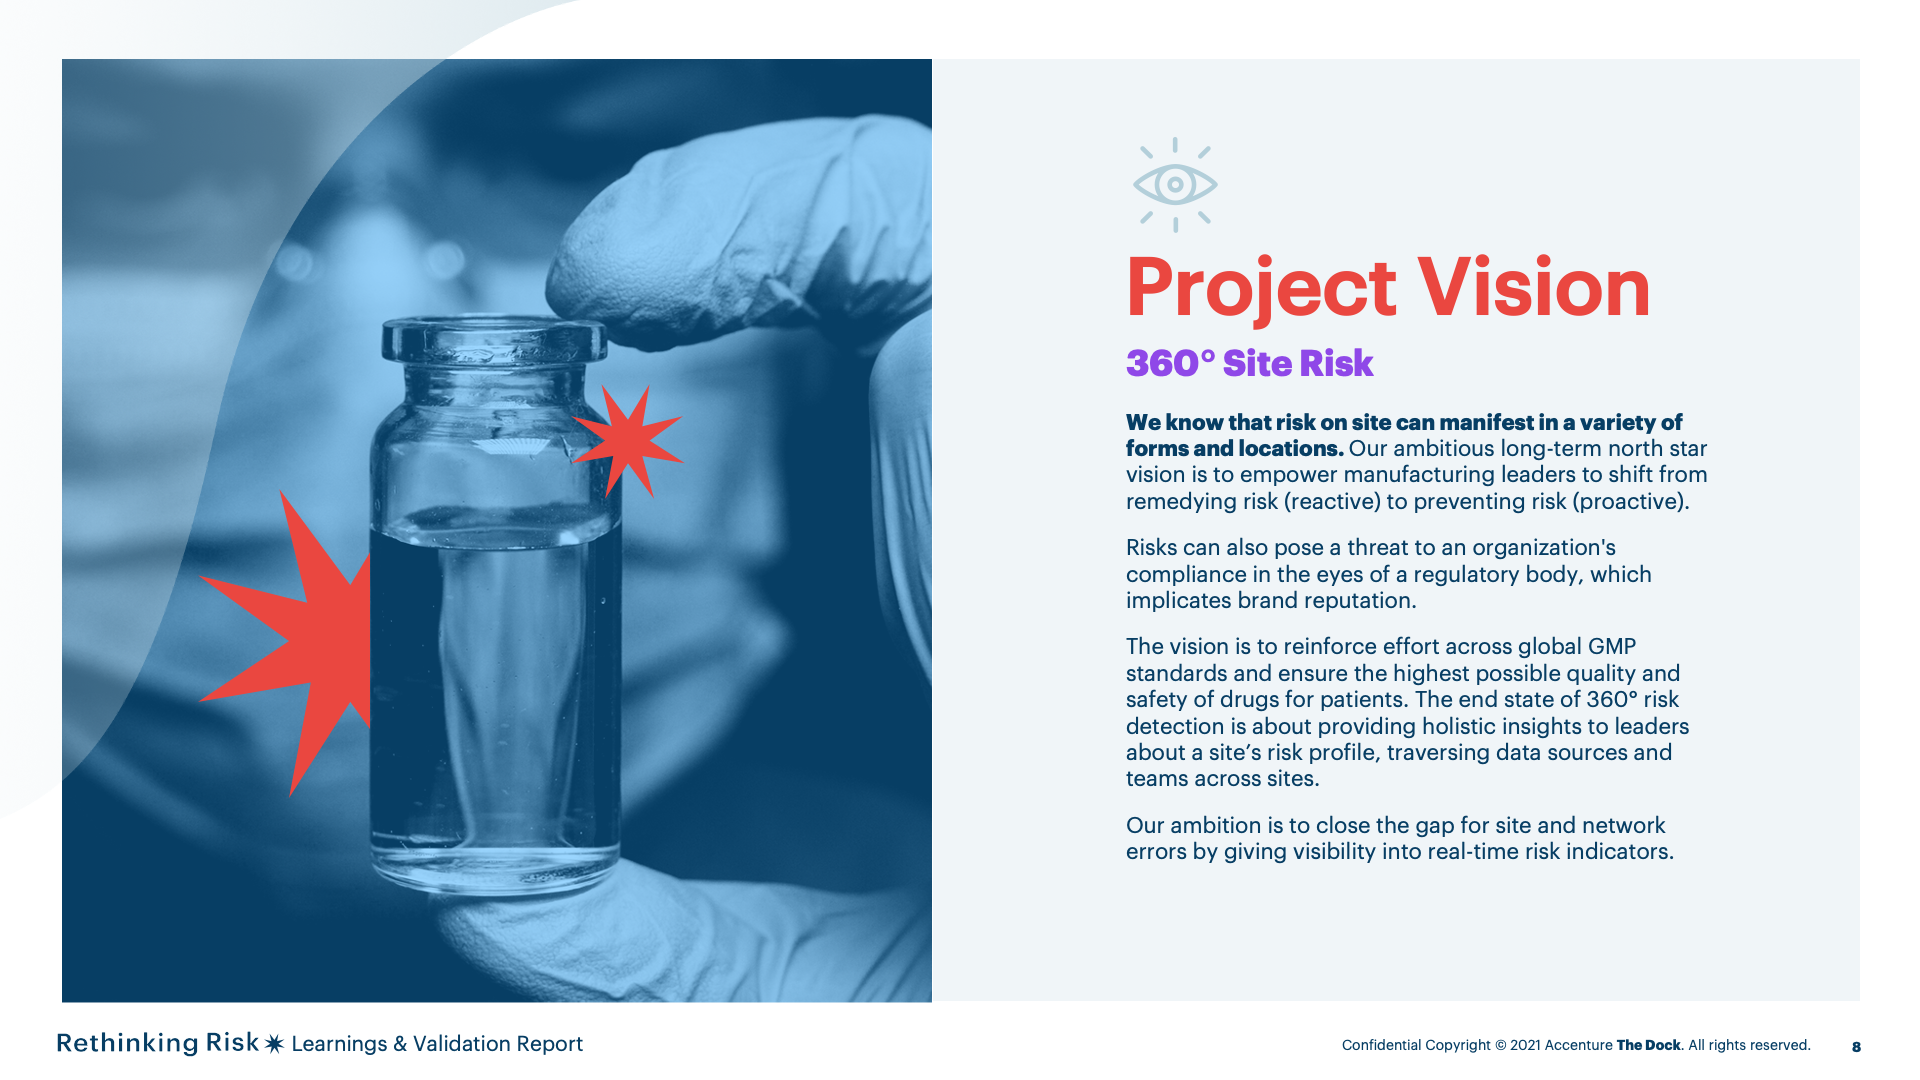
We know that risk on site can manifest in a variety of forms and locations. Our ambitious long-term north star vision is to empower manufacturing leaders to shift from remedying risk(reactive) to preventing risk (proactive).
Risks can also pose a threat to an organization's compliance in the eyes of a regulatory body, which implicates brand reputation.
The vision is to reinforce effort across global GMP standards and ensure the highest possible quality and safety of drugs for patients. The end state of 360° risk detection is about providing holistic insights to leaders about a site’s risk profile, traversing datasources and teams across sites.
Our ambition is to close the gap for site and network errors by giving visibility into real-time risk indicators.
The Risk Radar concept seeks to empower manufacturing leaders to proactively mitigate the potential manifestation of risks before they occur through:
This can be achieved by working around incompatibilities of data, enabling contribution and repatriating data to users. By constructing from individual monitoring contributions and providing sophisticated data analysis tools to strengthen regional capacity in coral reef monitoring, we can change the way in which we monitor coral reefs.
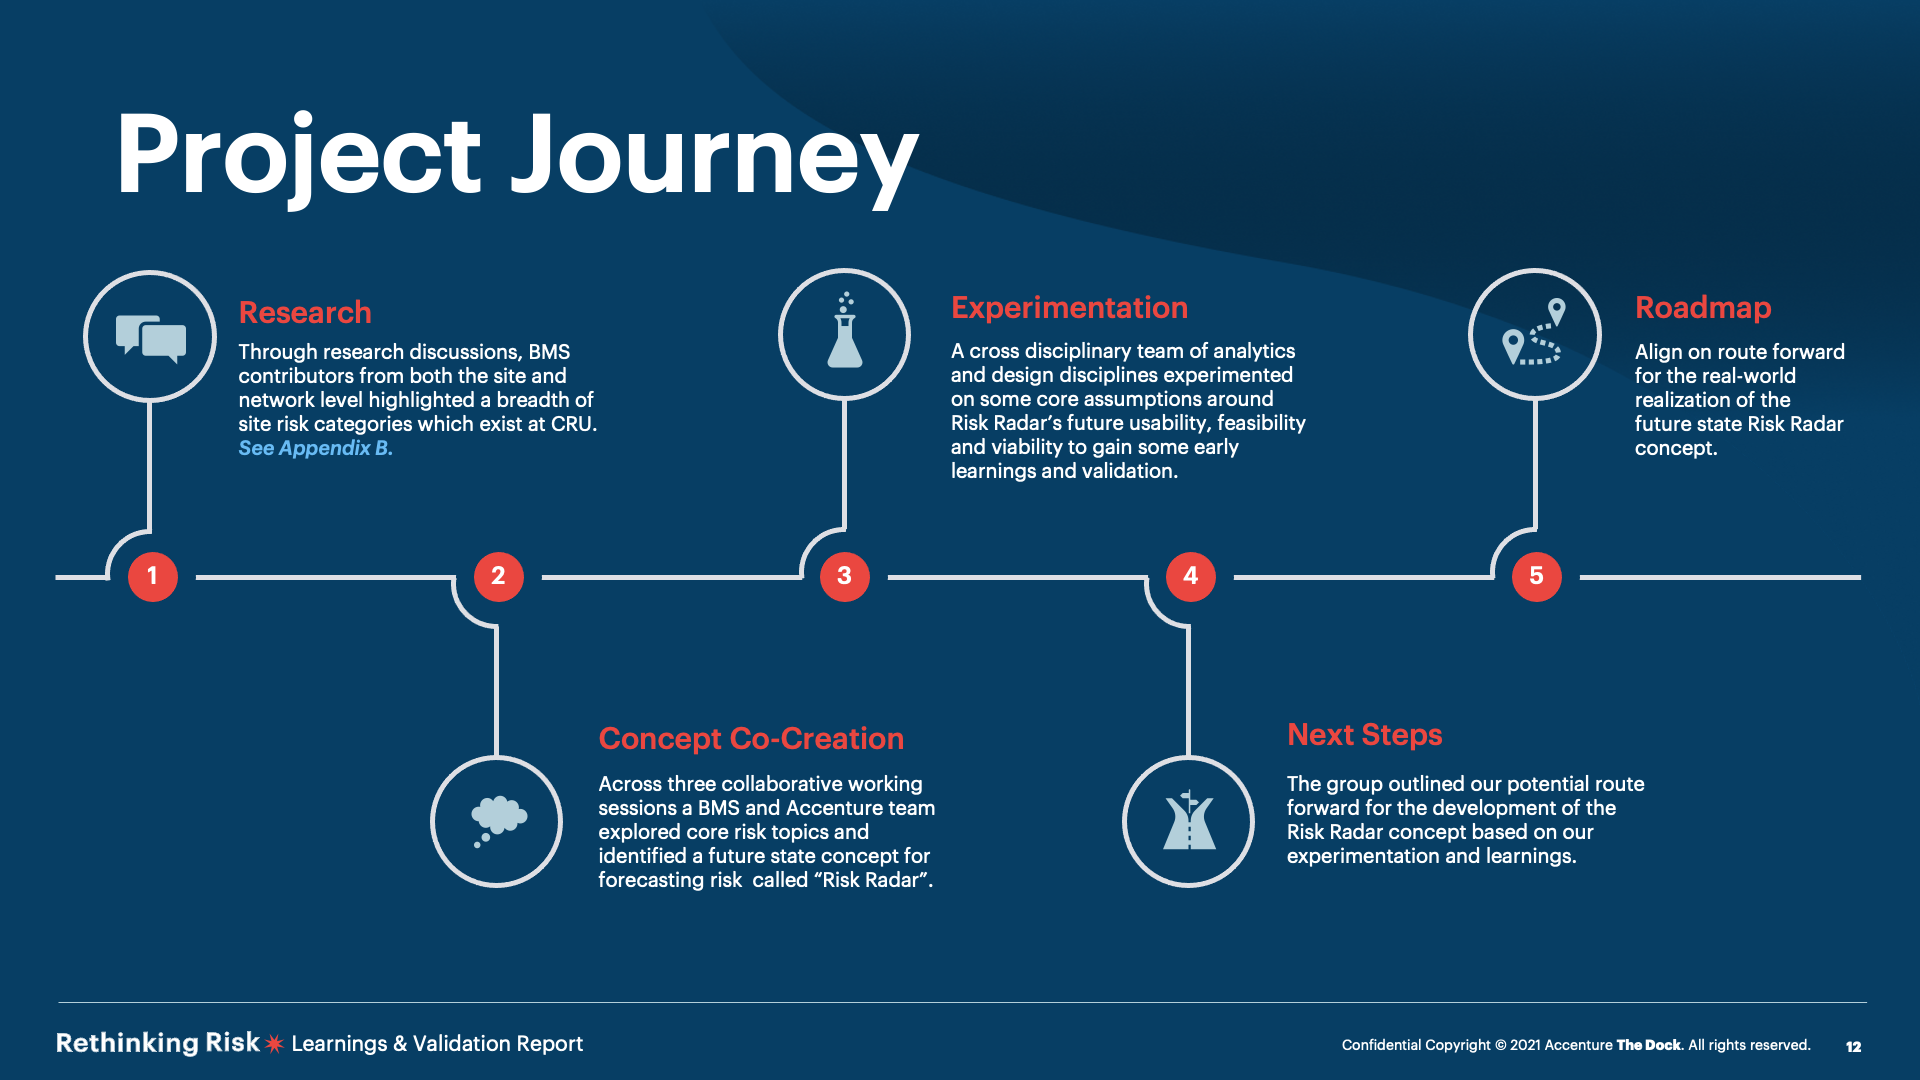
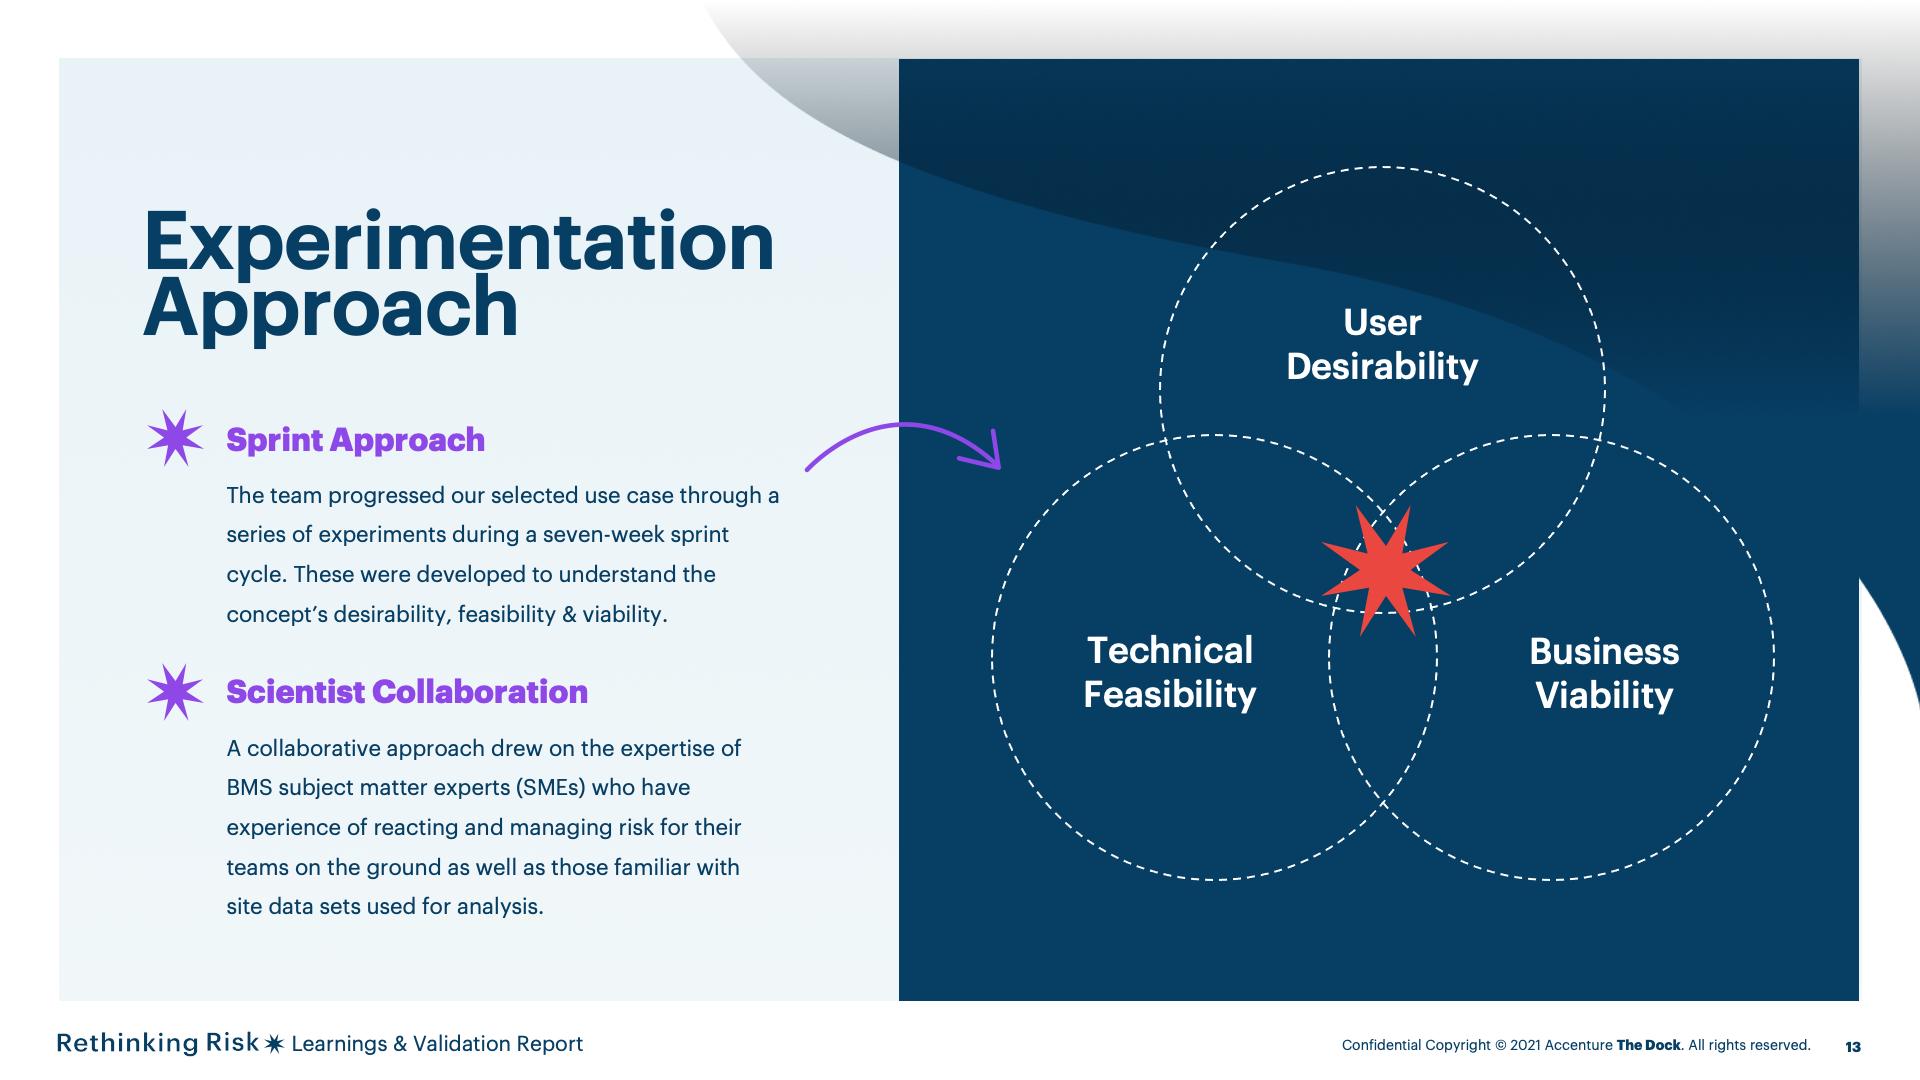
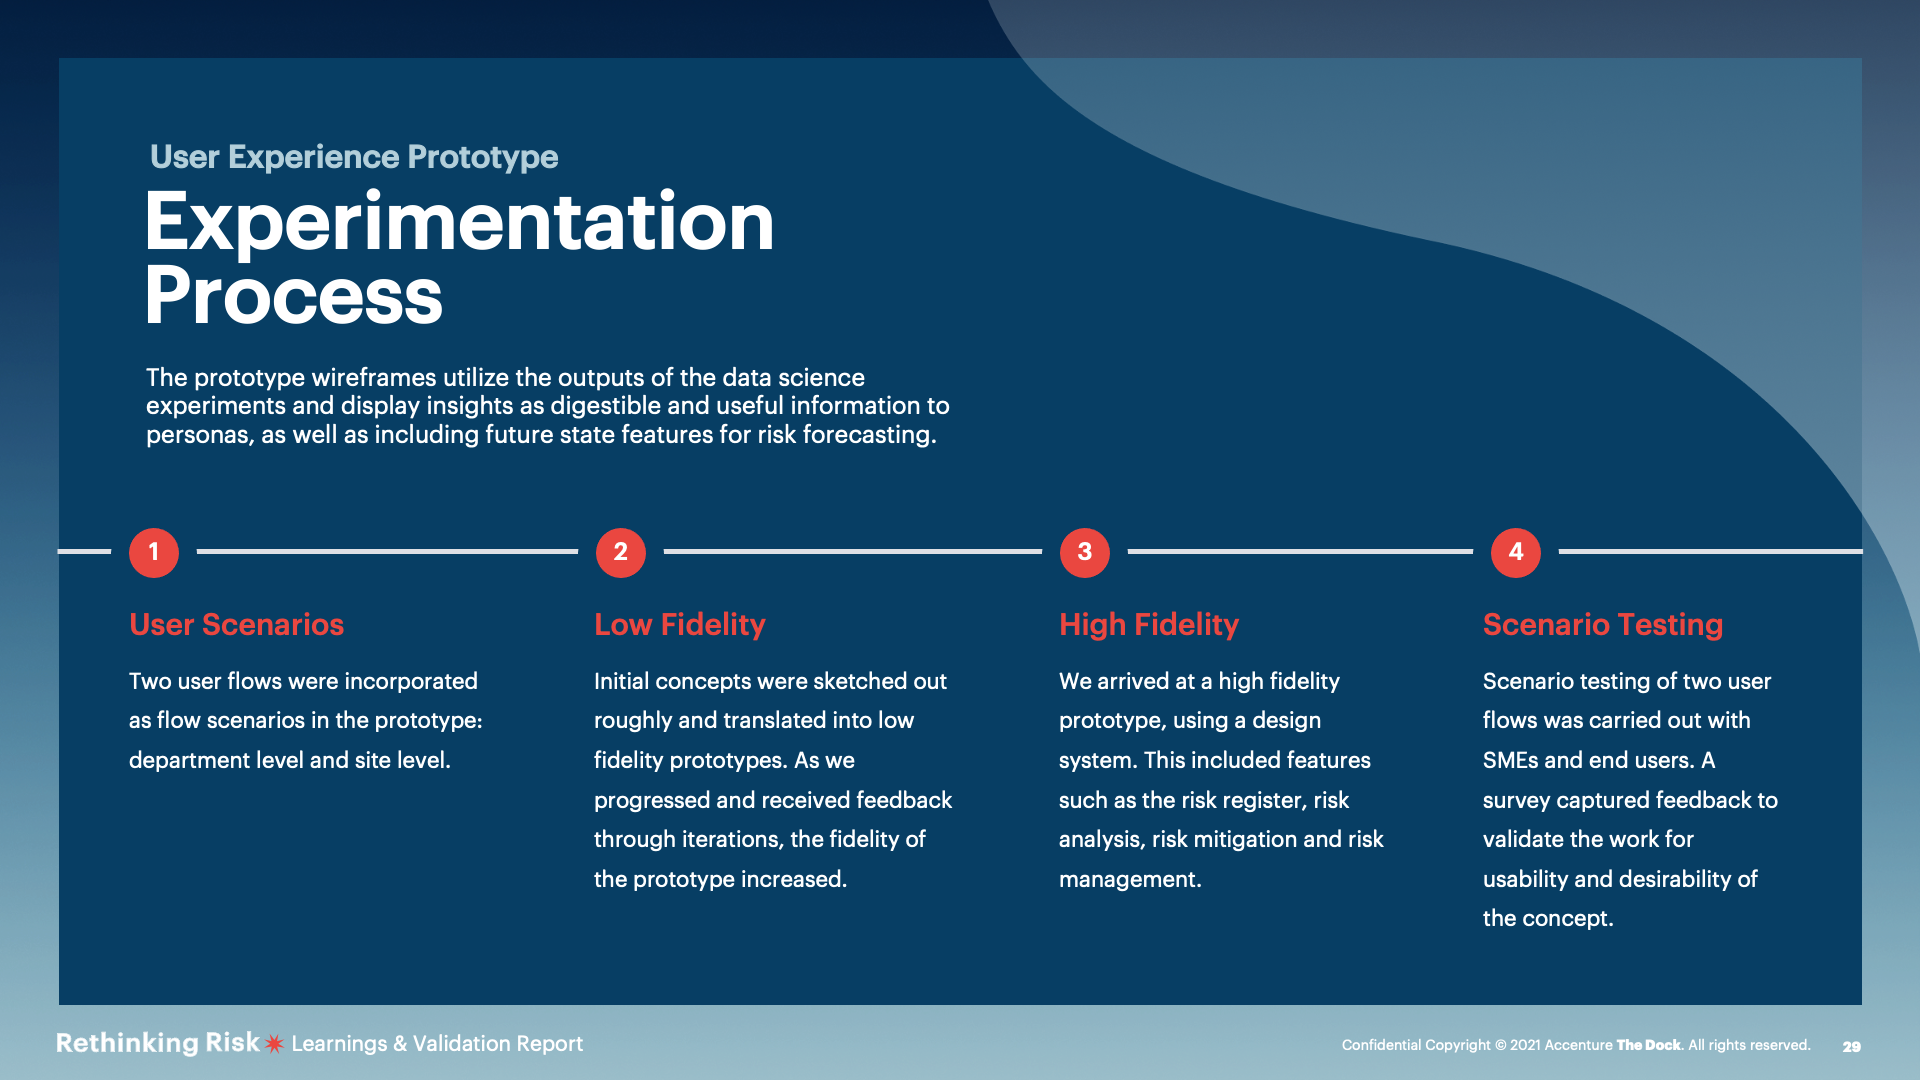
The team progressed our selected use case through a series of experiments during a seven-week sprint cycle. These weredeveloped to understand the concept’s desirability, feasibility &viability.
A collaborative approach drew on the expertise of BMS subject matter experts (SMEs) who have experience of reactingand managing risk for their teams on the ground as well as those familiar with site data sets used for analysis.

Design experiments were conducted including a user flow concept and a high - fidelity prototype. These were basedon user personas and scenarios identified in research.
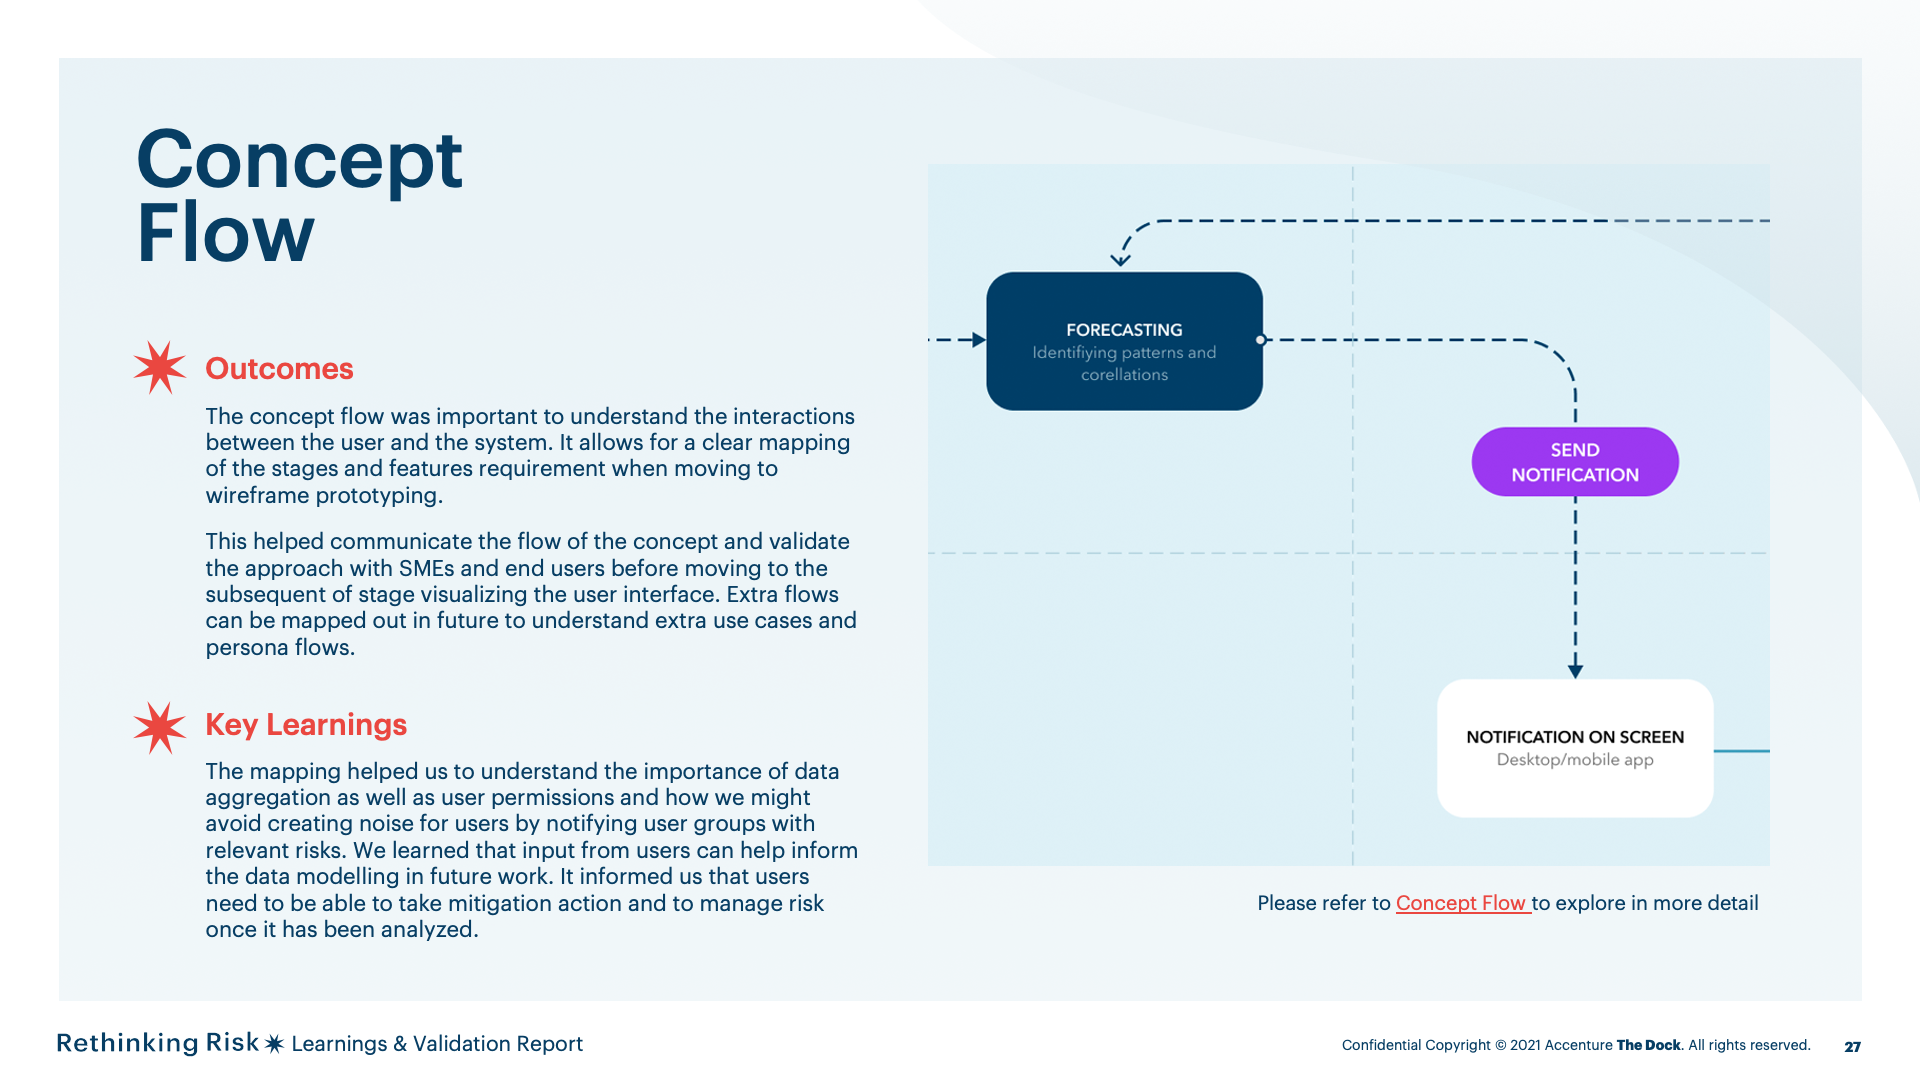
We believe a user would benefit from an experience instigated by a notified forecasted risk. The user will make a better informed decision with data insights to analyse, mitigate and manage the risk event before it manifests.
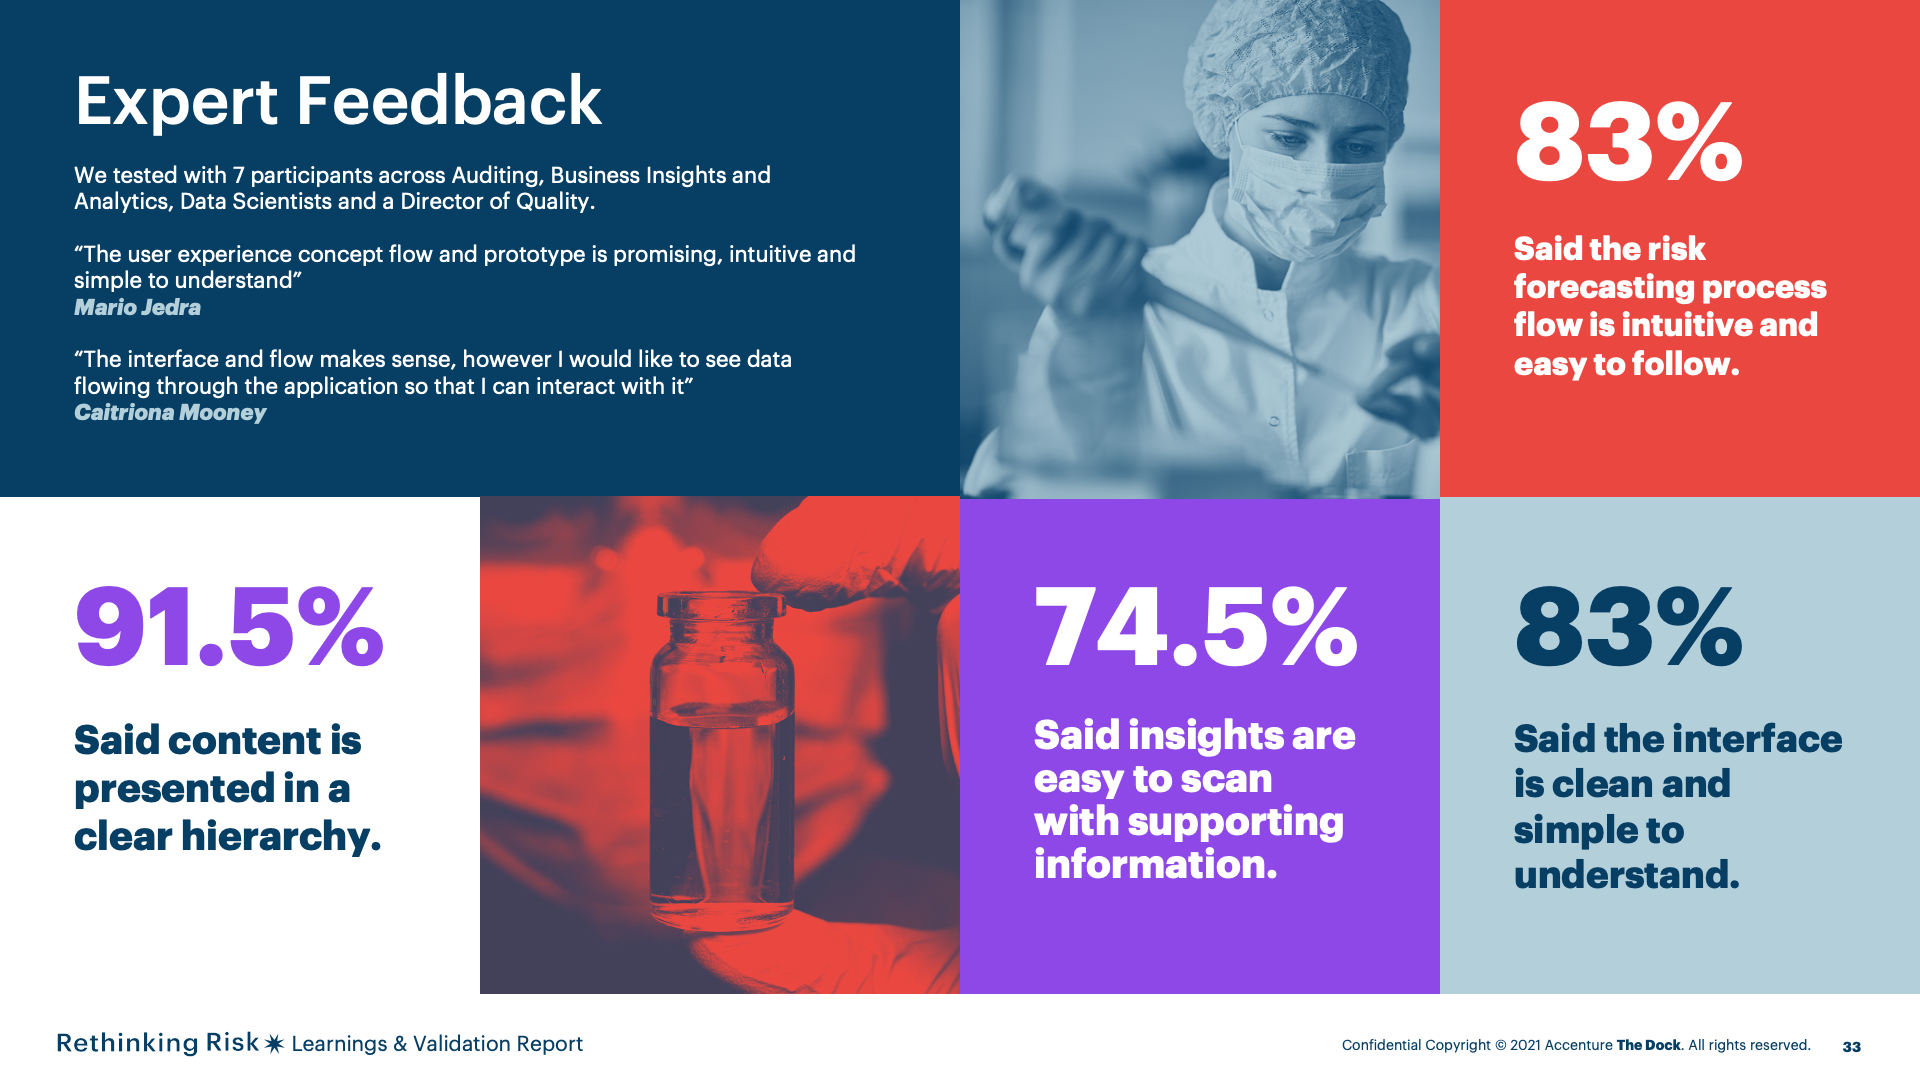
SME and end user participants for feedback and validation.
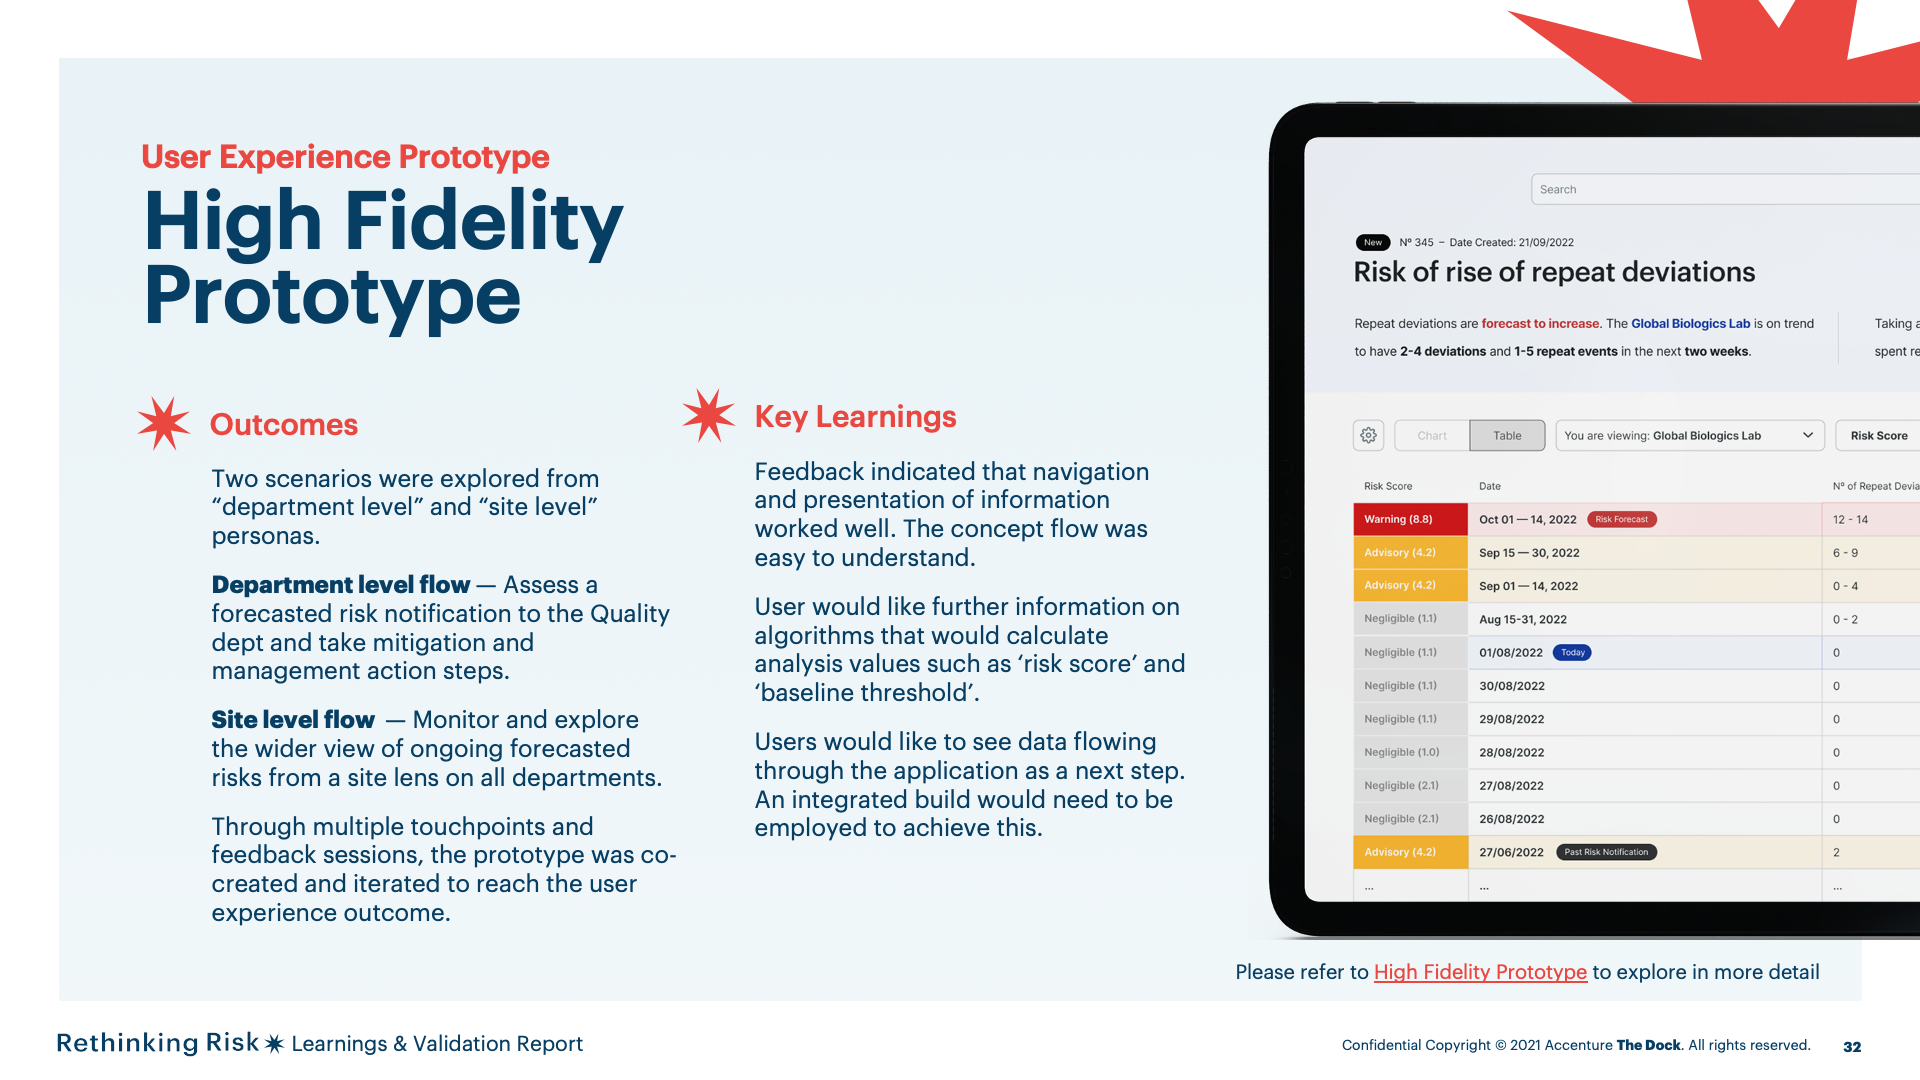
Usability and desirability scoring from SMEs and end users through scenario testing and survey.
Positive validation of a user experience future concept that is usable and desirable with opportunity for expansion in future explorative work. Please, refer to the high – fidelity prototype and the concept flow for more detail.

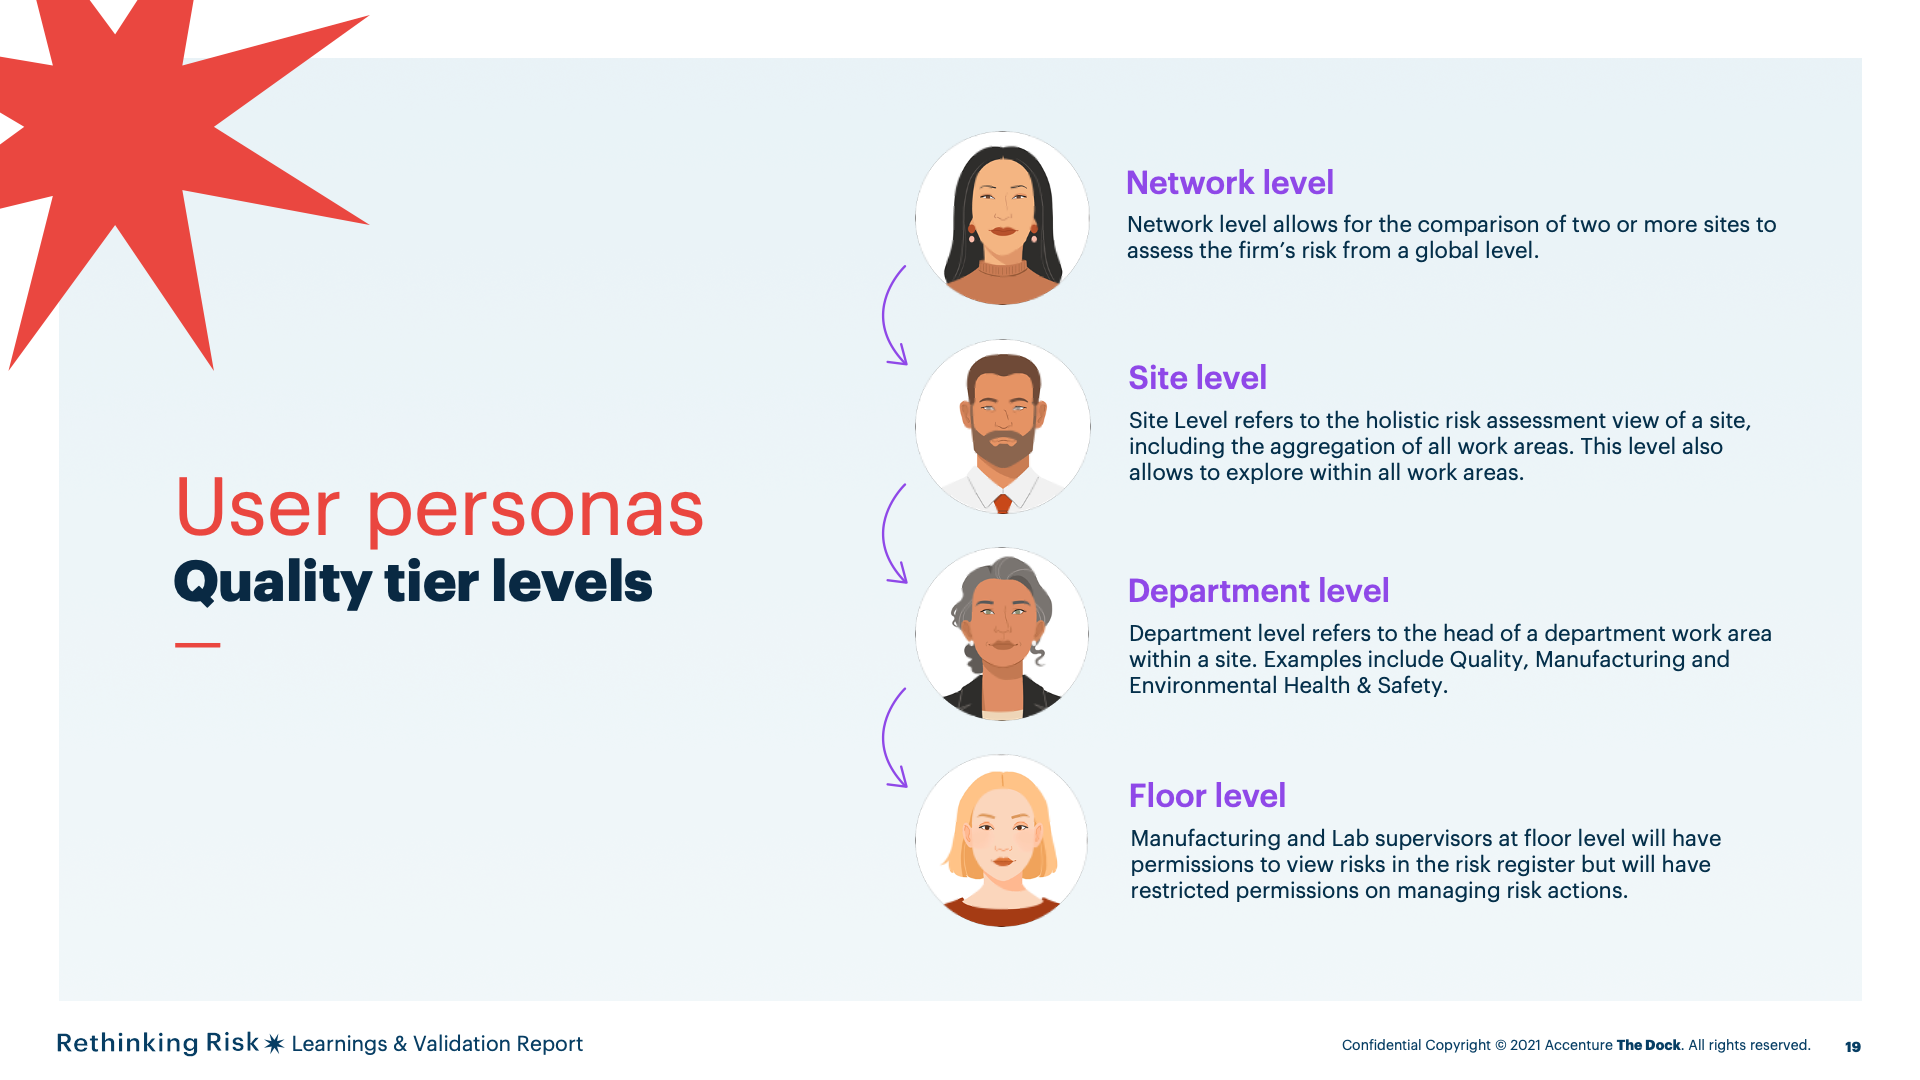
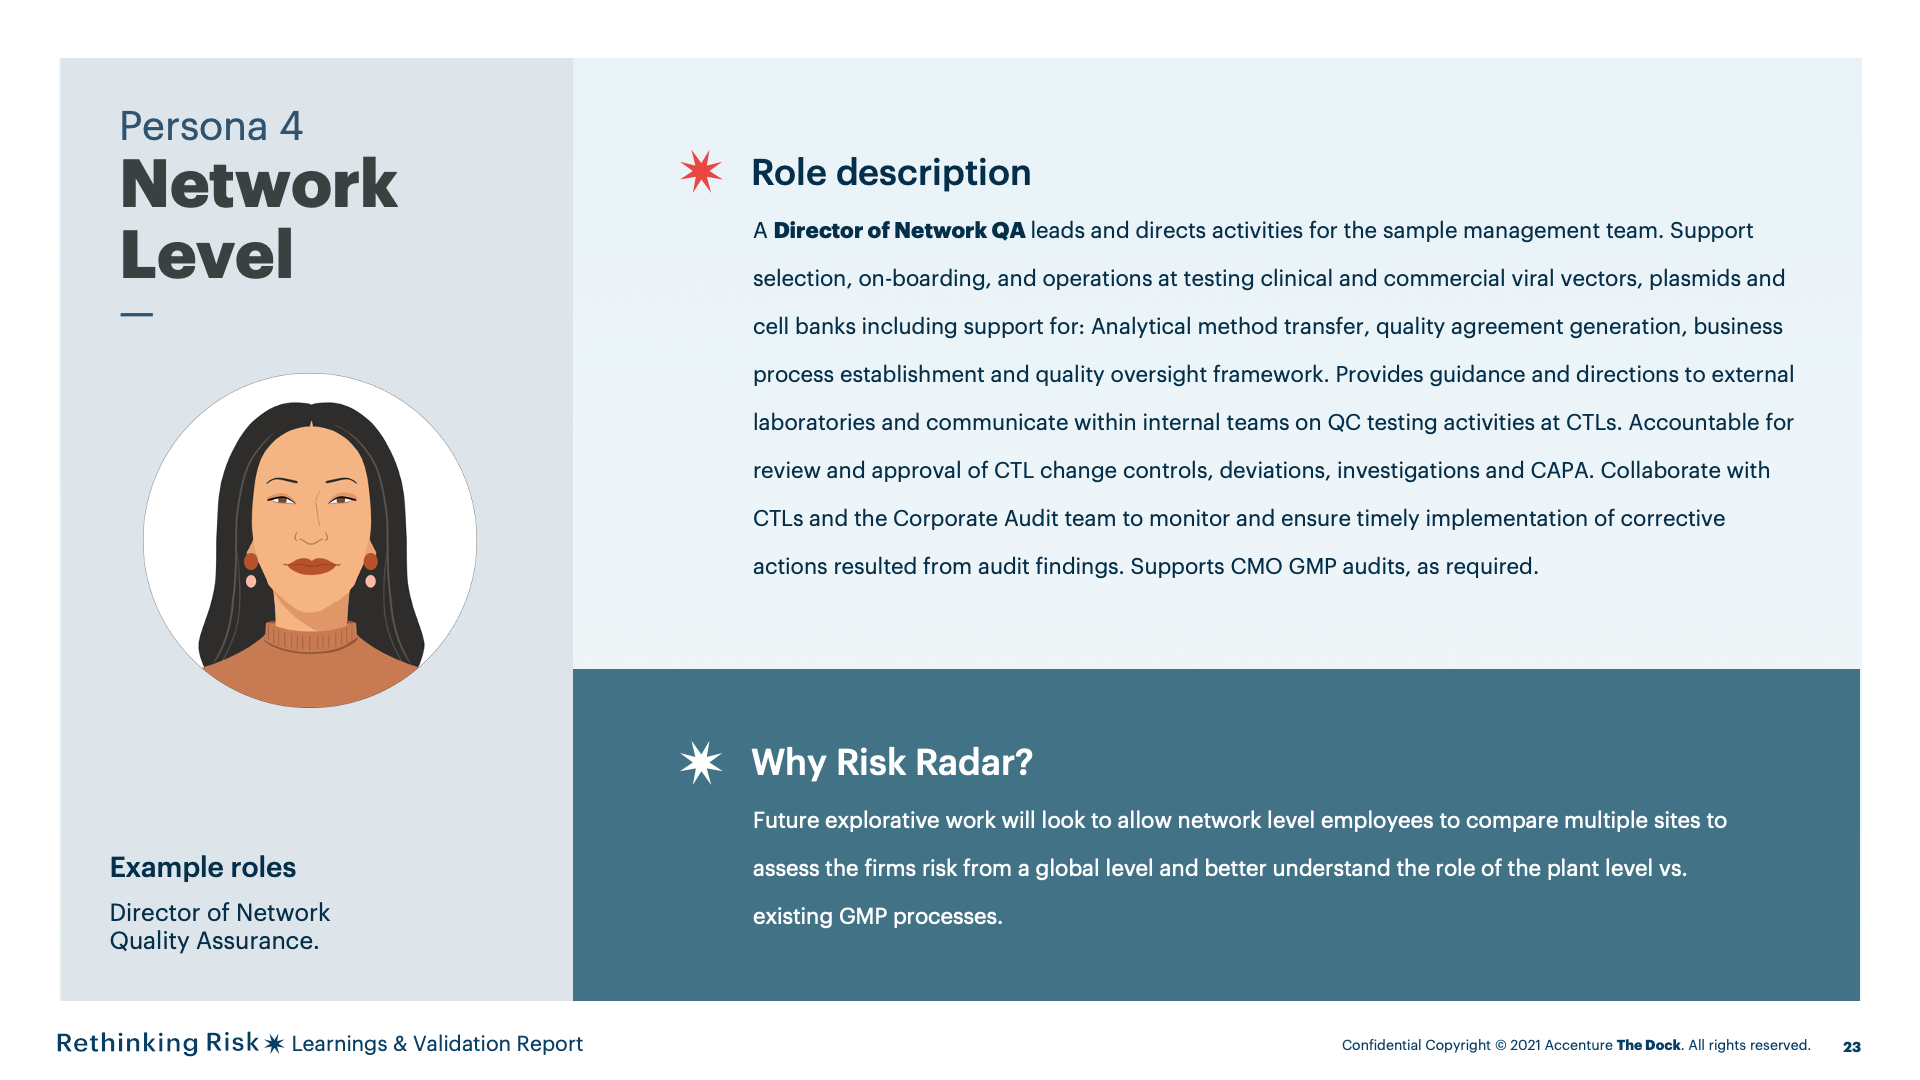
Network level allows for the comparison of two or more sites to assess the firm’s risk from a global level.
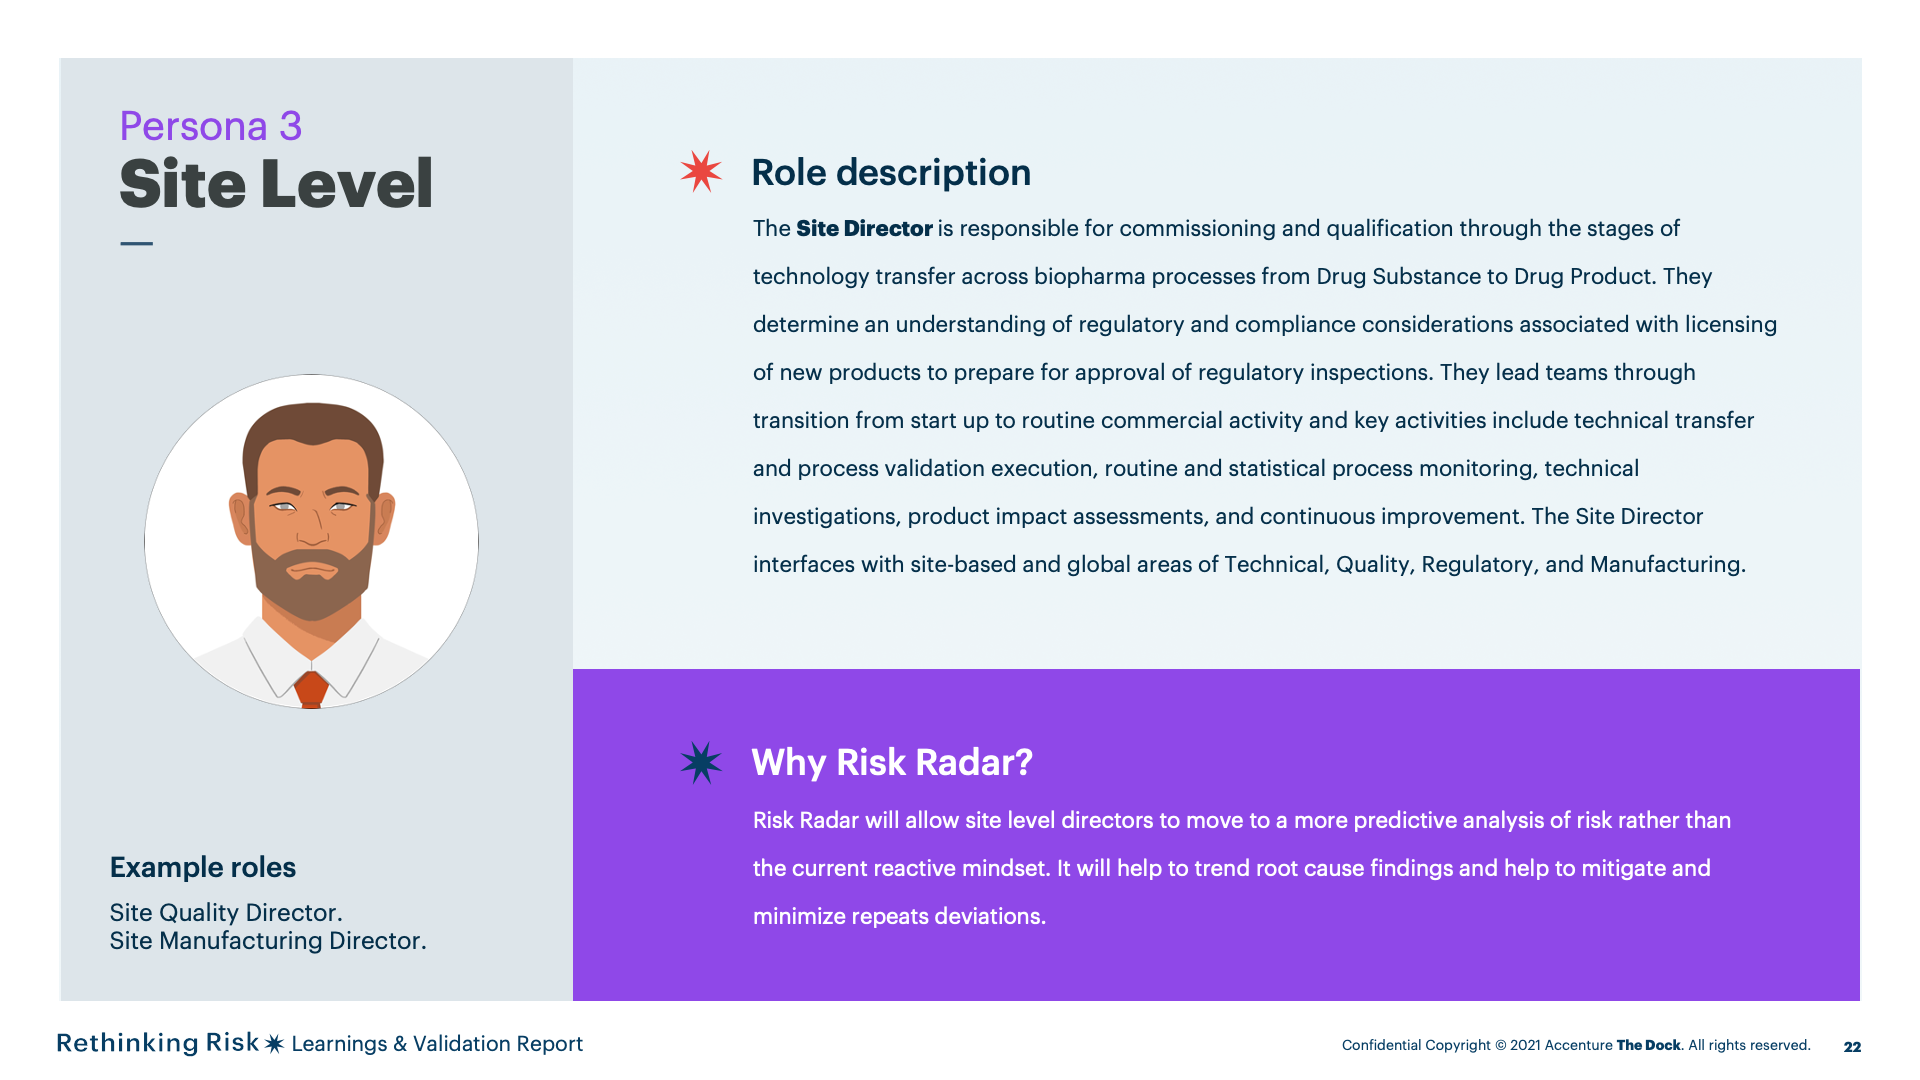
Site Level refers to the holisticrisk assessment view of a site, including the aggregation of all work areas.This level also allows to explore within all work areas.
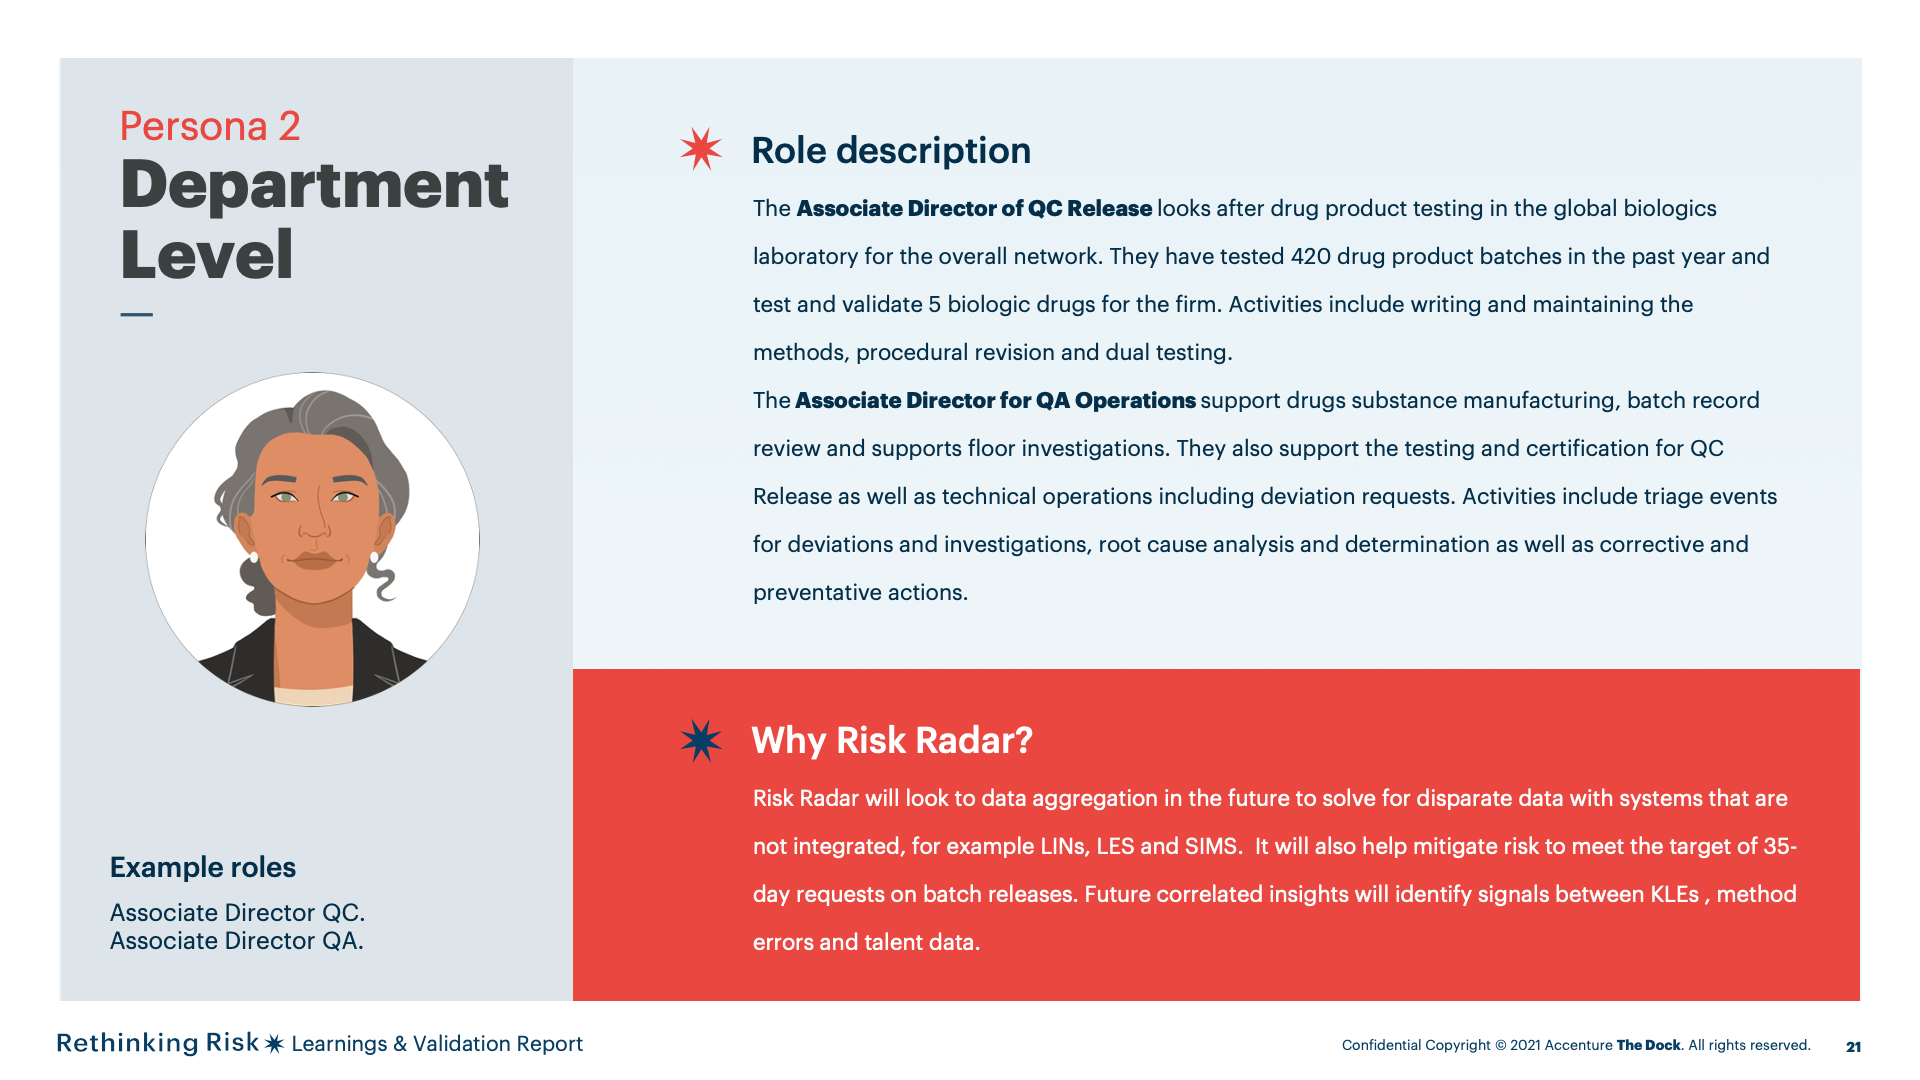
Department level refers to thehead of a department work area within a site. Examples include Quality,Manufacturing and Environmental Health & Safety.
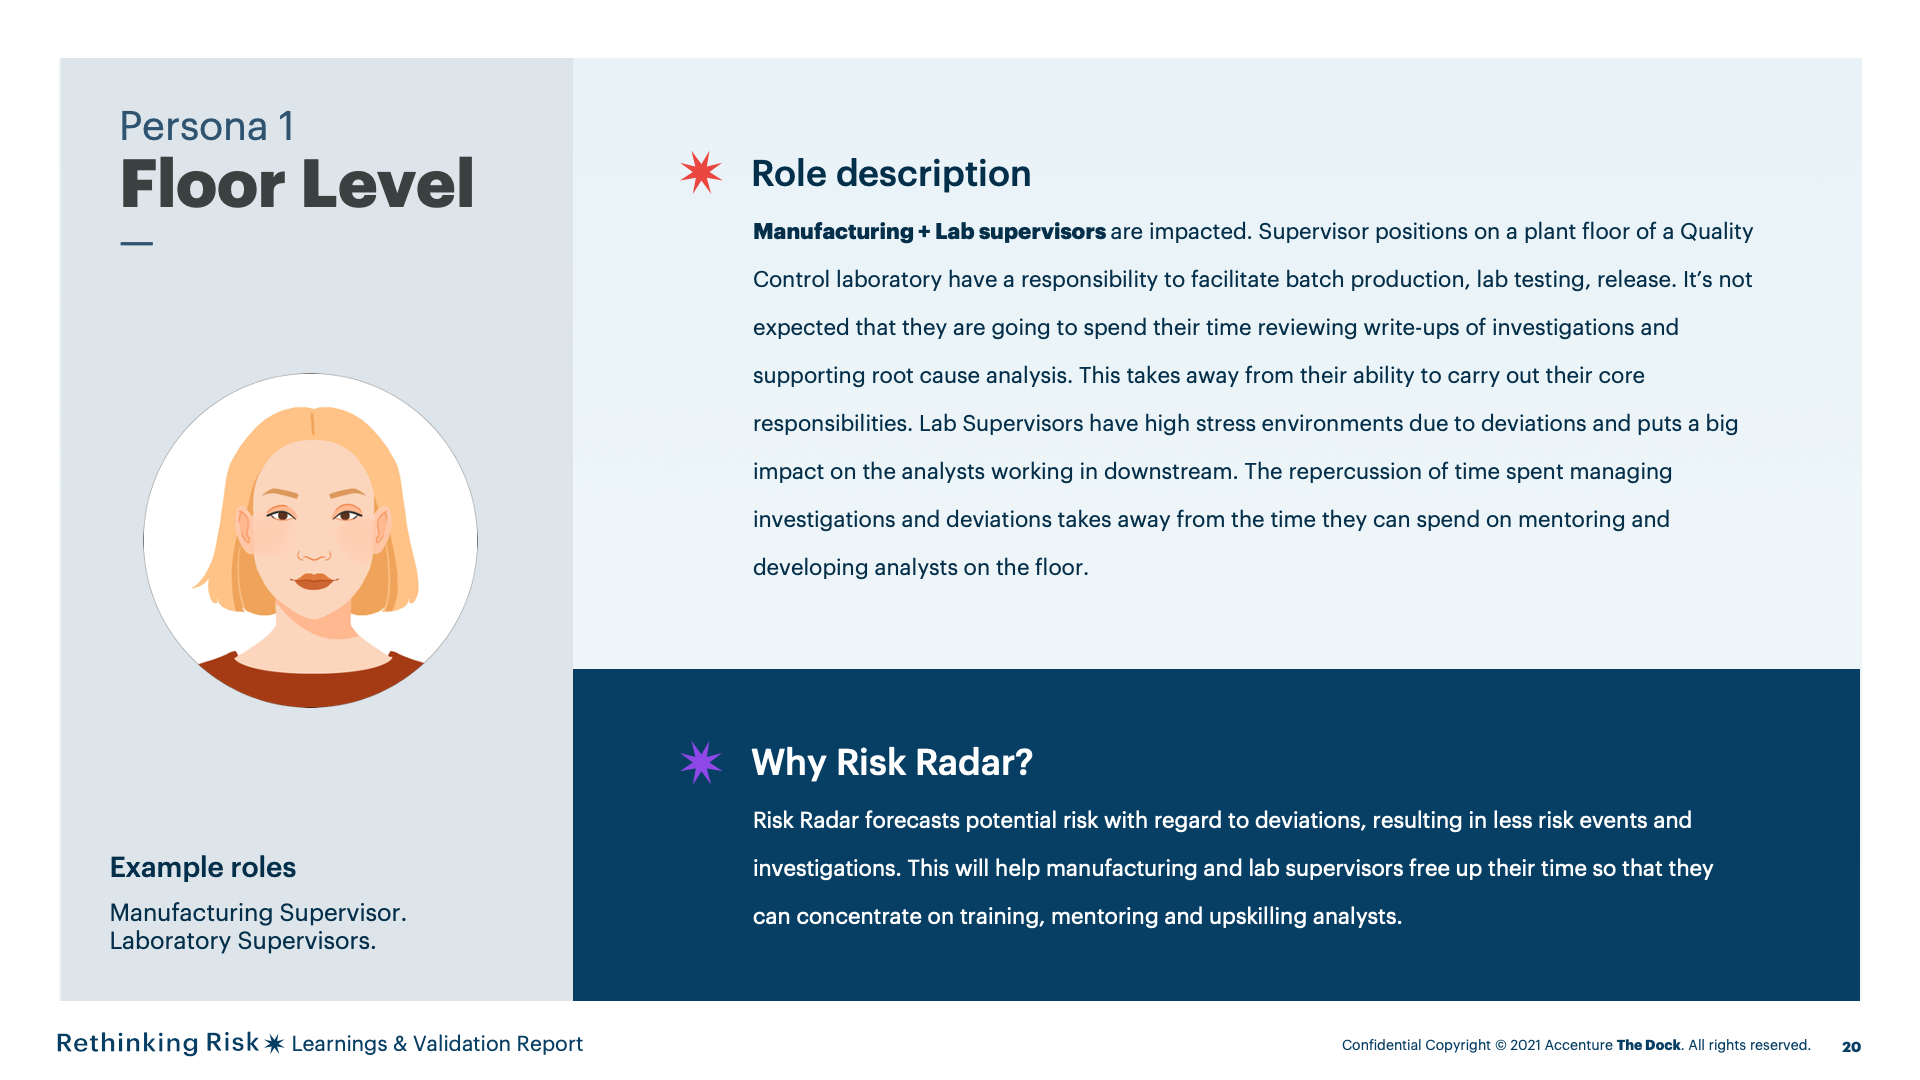
Manufacturing and Lab supervisorsat floor level will have permissions to view risks in the risk register butwill have restricted permissions on managing risk actions.

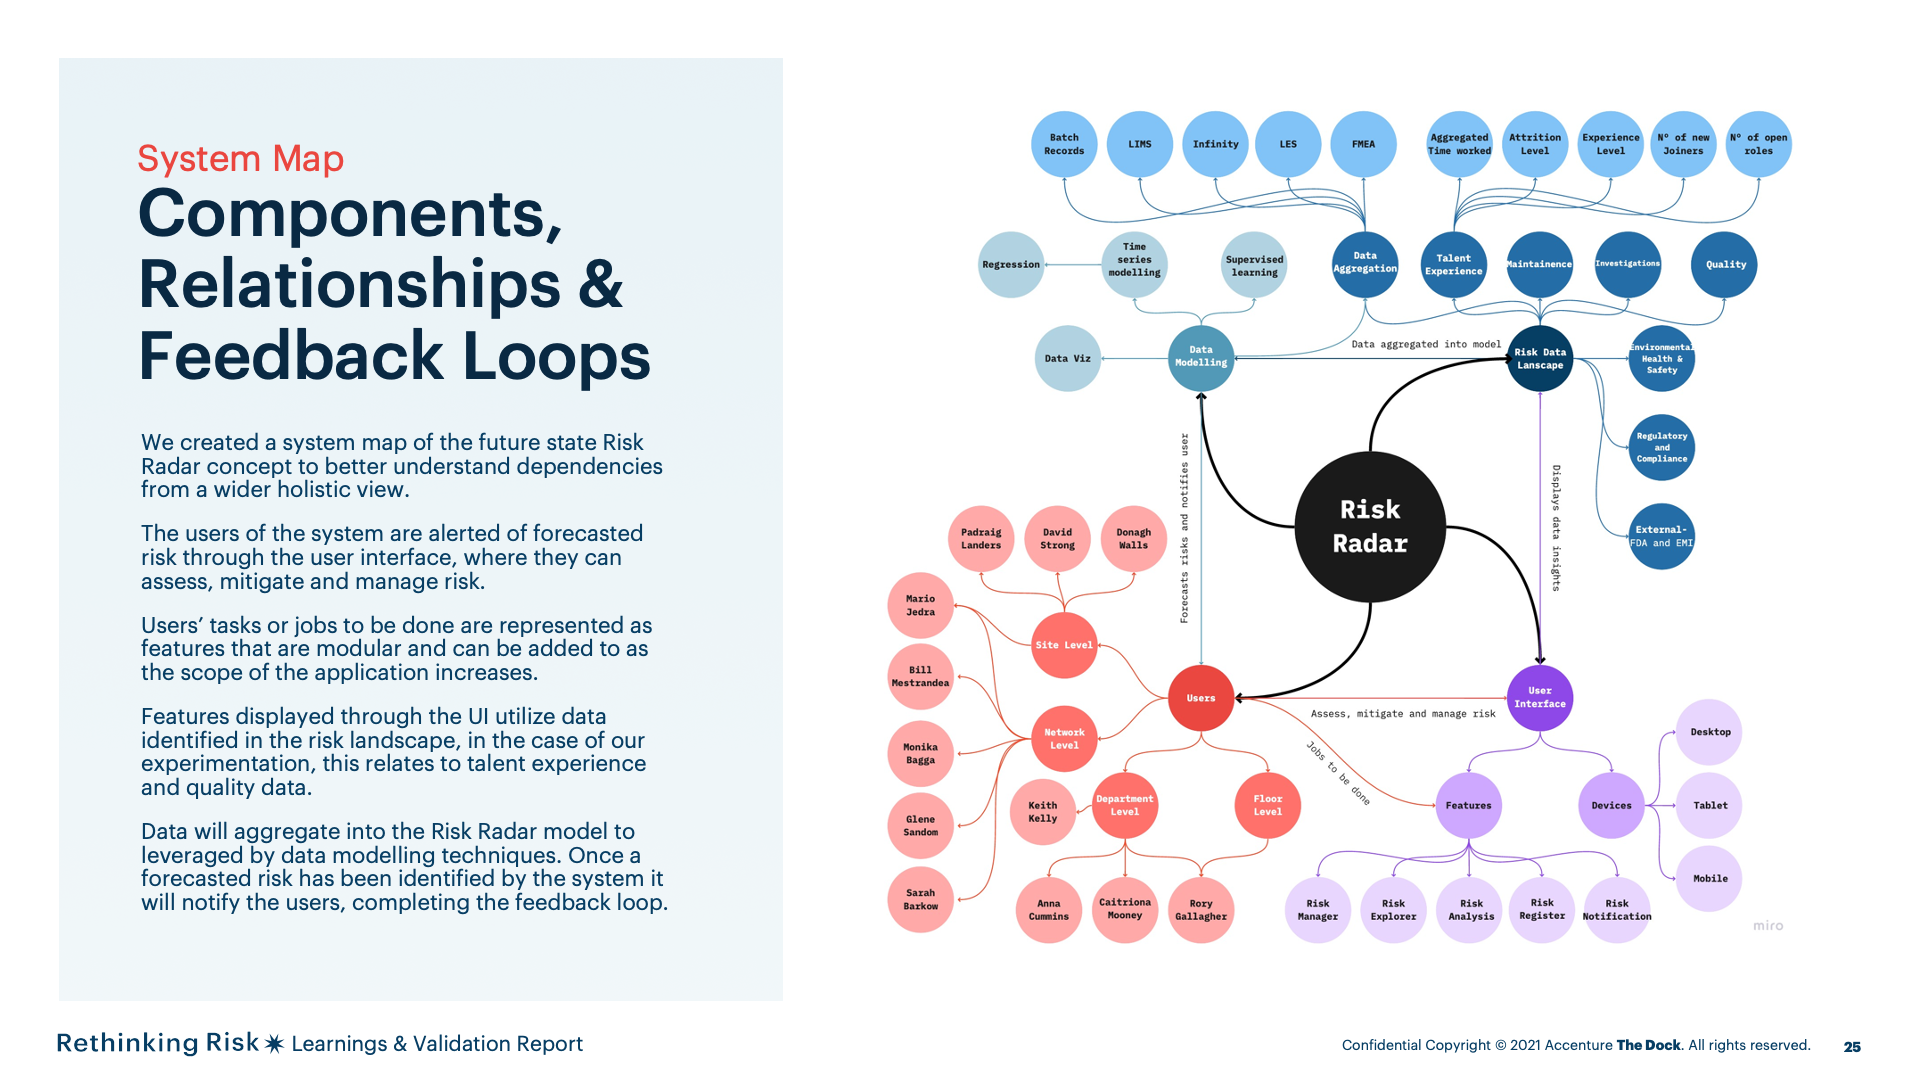
We created a system map of the future state Risk Radar concept to better understand dependencies from a wider holistic view.
The users of the system are alerted of forecasted risk through the user interface, where they can assess, mitigate and manage risk.
Users’ tasks or jobs to be done are represented as features that are modular and can be added to as the scope of the application increases.
Features displayed through the UI utilize data identified in the risk landscape, in the case of our experimentation, this relates to talent experience and qualitydata.
Data will aggregate into the Risk Radar model to leveraged by data modelling techniques. Once a forecasted risk has been identified by the system it willnotify the users, completing the feedback loop.


The concept flow helped us to define the interdependencies between the user and the system and the definition of high level user actions and UI screens.


The user experience was tested for usability and desirability with various stakeholders and end-users across Quality, Manufacturing, Auditing, Regulatory Compliance, Business Analytics and Insights. Data science outputs were referenced and reflected in the front end design. The concept and prototype was validated and a new phase has been established to further the R&D of the project with a view to industrialisation in the future phase.